
"Market Correction vs. Bear Market: Understanding the Recent Decline in Indian Markets"
Understanding Market Corrections
Stock markets are known for their ups and downs, but did you know that 10-20% temporary declines occur almost every year? While these fluctuations may seem alarming in the short term, history shows that they are part of the market cycle and should not cause panic among investors.
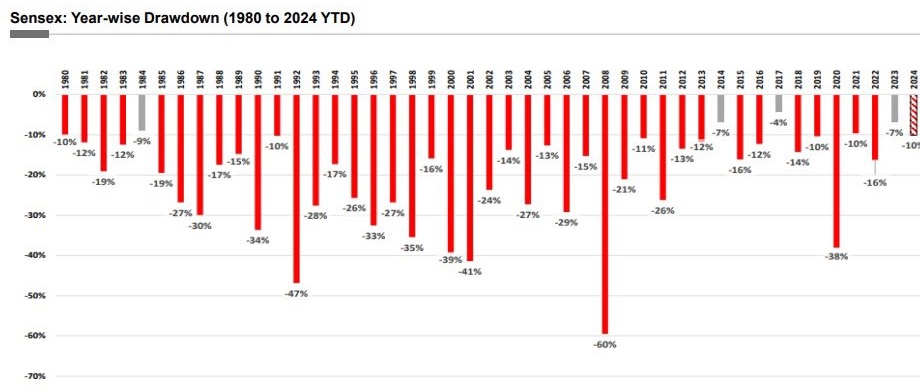
A look at historical data from Sensex (1980-2024 YTD) reveals a compelling trend—only 4 out of the last 44 years experienced intra-year declines of less than 10%. This means that drawdowns are not an exception but a norm in the stock market.
Historical Drawdowns: What the Data Says
The chart below illustrates the year-wise drawdowns of Sensex from 1980 to 2024. It clearly shows that even in bull markets, temporary declines are common:
Source : MFI, FundsIndiaResearch
Key Observations:
- The market faced declines of 10-20% in most years, indicating that short-term volatility is normal.
- Some years witnessed sharp corrections, including -60% in 2008, -47% in 1992, and -41% in 2001.
- Despite these declines, Sensex has consistently reached new highs over the long term.
From Major Drawdowns to Final Returns: Key Insights from Nifty’s Volatility
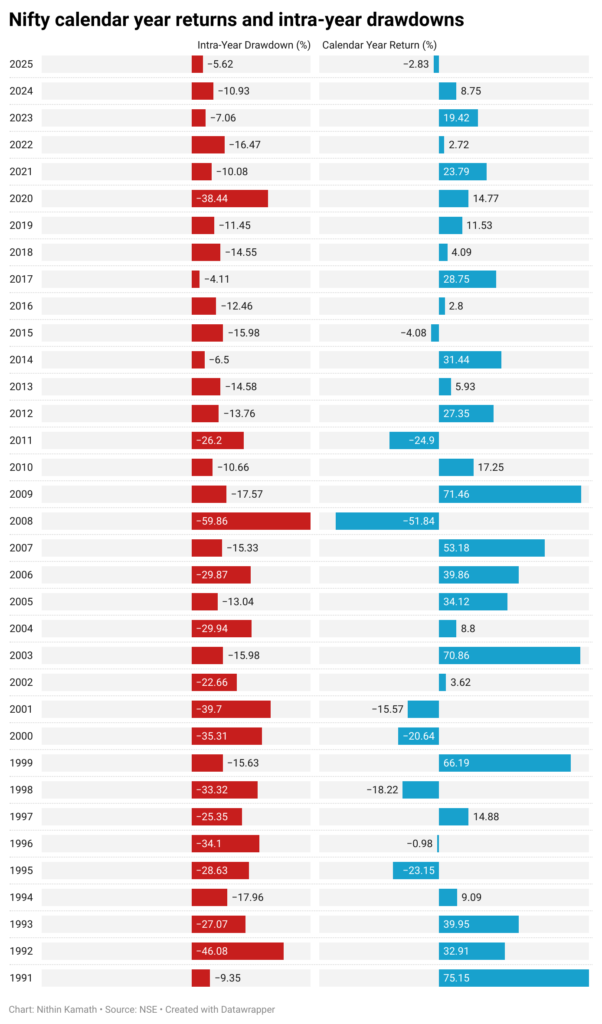
- This chart underscores how the Nifty’s intra-year dips (shown in red) and its eventual calendar-year returns (in blue) can diverge significantly—illustrating the market’s capacity for both startling volatility and remarkable resilience.
- In 2008, for example, the index tumbled nearly 60% at one stage before ending the year down around 51.8%, while 2020’s drawdown of roughly 38% gave way to a respectable 14.7% gain by year-end.
- Another standout instance is 2022, which slipped by around 16.5% at its low point but still closed the year with a modest positive return of 2.7%.
- These cases highlight a recurring theme in equity markets: precipitous mid-year declines do not necessarily determine full-year performance, as rebounds can substantially mitigate or even reverse losses.
Corrections ≠ Bear Markets
- A correction is a temporary decline of 10-20% from recent highs, often driven by macroeconomic concerns, global uncertainties, or profit-booking.
- A bear market, on the other hand, is a prolonged downturn where markets decline 20% or more, often accompanied by an economic recession.
Lessons for Investors: What Should You Do?
- History proves that markets bounce back stronger after corrections. Panic selling only leads to missed opportunities.
- Instead of fearing market drops, savvy investors use them to buy quality stocks and mutual funds at lower prices.
- Short-term volatility is unpredictable, but long-term growth is steady. Investors who held their investments through past corrections have seen substantial wealth creation.
Final Takeaway: Volatility Is the Price of Admission
Smart investors don’t panic—they plan! Are you ready to ride the market waves?
Disclaimer: The information provided in this newsletter is for educational and informational purposes only. It is not intended to serve as financial, investment, or trading advice, nor does it constitute a recommendation to buy, sell, or hold any securities. The analysis shared herein is based on publicly available information, which may be subject to inaccuracies or changes without notice. Readers are strongly encouraged to perform their own research and consult with a licensed financial advisor before making any investment decisions. Past performance is not indicative of future results, and all investments carry risks, including the potential loss of principal.
Disclosure: Investment in the equity market and securities is subject to market risk; read all the scheme-related documents carefully.