Skip to content
Home
About Us
Services
Mutual Fund
Retirement Saving
Life Insurance
Health Insurance
Taxation
PMS/AIF
Resources
MF Tools
Financial Calculator
Goal Planner-Calculator
Download
Blog
Career
Contact Us
Login
Enquiry
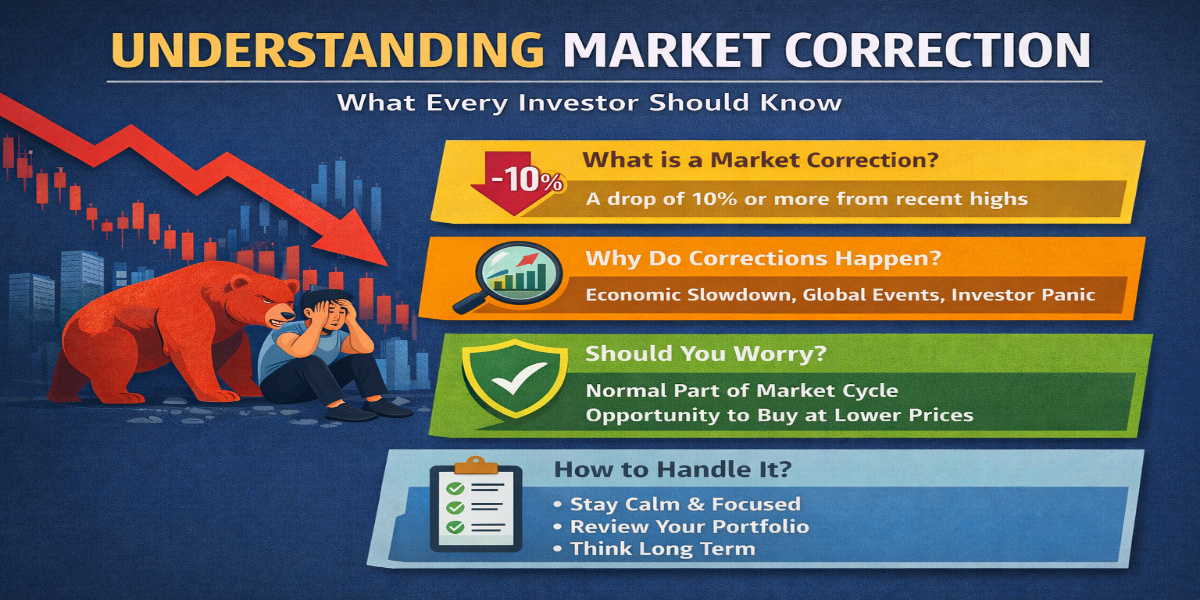
Protected: UNDERSTANDING MARKET CORRECTION | Omega Financial
March 11, 2026
Omega-financial
Enter your password to view comments.
Financial Blog
#IndianStockMarket
#InvestingStrategy
#MarketCorrection
This content is password protected. To view it please enter your password below:
Password:
Omega-financial